TIMElusive
Dedicated to trading with technical analysis.
Thursday, October 13, 2016
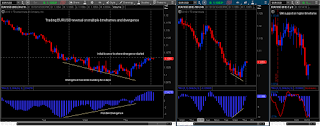
Trading EURUSD reversal on multiple time frames and divergence
The key to this trade is to have enough patience to wait for the right time and price to pull the trigger. Because the divergence forms for 2 days all the while the price is going down, opening the trade at any price during this time will face drawdown before the price finally reverses. I would say it takes practice to catch the perfect timing for pulling the trigger. But, even if you didn't pick the perfect entry, if you took the trade after it showed divergence, eventually the price moved above that level. Therefore, what is more important is to have conviction on your analysis to stay with the trade.
Some people say that the market moves in random, but I have discovered that the chart, the graphical representation of the market, is a precise technical mechanism that can be used to predict quite accurately future price moves. Some people also say that indicators lag and they don't work, but they simply don't know how to accurately read a chart.
Friday, July 20, 2012
6E - Trade the conclusion on 1 hour chart
What can I say? I have already said it on the chart. Well, then there are the other timeframes and other indicators that also support this trade, but keeping it simple is the way to go. It's a matter of can you trust the setup and take the move by taking the trade and holding. Yeah, that is definitely the challenge. One thing is true, the technical setup doesn't fail. It is what it is.
The bearish divergence took 3 days to build, and gave accurate clue as to which way it will move before the move actually happened. Check the 4 hour chart and see how it confirms this setup.
The bearish divergence took 3 days to build, and gave accurate clue as to which way it will move before the move actually happened. Check the 4 hour chart and see how it confirms this setup.
Tuesday, July 10, 2012
6E - 1 hour and 5 min chart together
For this trade, you would have to spot the divergence being setup on 1 hour, and at the same time recognize head and shoulders pattern on 5 min chart, to take the trade at close to the high, and hold it for 5 hours to get the full move being made on this setup, as the price goes up and down making lower high and lower lows. 1.2246 that it hit is -50% fibonacci extension from 1.2759 - 1.2417, which was the initial down move from the previous high.
Friday, June 8, 2012
6E - Rising Wedge and ADX
6E has made 339 tick bounce from 1.2288 in what has been a steadily declining downtrend, but it built a rising wedge, and with negative divergence on 1hour chart, turned back down. Notice the price level of 1.2627 where it reversed was the previous low, which was support now resistance. On the daily chart, you can see ADX rising to support the steady downtrend before the 339 tick bounce, and when it began to turn down, the price began to rise. And, yes, I shorted 1.2626, 1 tick below the high.
Saturday, May 19, 2012
6E - Divergence on multiple timeframe
Trading divergencies is not easy, even though the chart in hindsight always shows that it works. Here is a good example of divergences in control. The continued downtrend from 1.3287 fell 643 ticks and made a low print at 1.2644, building a bull wedge to the low and creating multiple divergencies on MACD on multiple timeframe charts. The bounce made it to 23.6% Fib retracement level, 1.2796, which is a whopping 152 ticks move from the low. This proves that the divergencies can be traded. Although, all trading rules must be applied to take advantage of this trade setup and analysis as always, which include patience and discipline. I believe practice makes it perfect, so keep trying and it can be done. One thing is for sure, market will always provide a new setup, whether you can take advantage of it or not is up to you.
Subscribe to:
Comments (Atom)


